The Private Equity Investment Process: Case Study of a Dental Clinic Leveraged Buyout
In this article, I seek to play the role of a private equity investor, highlighting the investment process, including initial market analysis, competitive mapping, and cost structure evaluation, as well as the creation of a three-statement financial model for the leveraged buyout of multiple dental clinics in a roll up transaction.
The purpose is to highlight some of the skills associated with the private equity industry and provide insight into how to evaluate potential investments. The hypothetical investment is the purchase, using leverage, of 5 dental clinics in Chesterfield, Missouri.

The Dental Clinic Roll Up
Dentistry has attracted a considerable amount of private equity capital, ranging from large transactions like KKR’s purchase of Heartland Dental, which supported more than 1,300 dentists across 35 states, to micro transactions of a small number of clinics within the same geography.
Private equity funds cite the large market, valued at over $73 billion, the opportunities for value creation in enhanced efficiencies, improved marketing, and investments in sophisticated technology that work at scale as reasons for investing in the space. These are just three of the benefits of a roll up strategy, with the others shown later in the following analysis; however, in order to formulate a data-driven opinion regarding the returns associated with a buyout of dental clinics, an investor must first come to understand the financials associated with one dental clinic- the unit economics.
The Financials of a Single Dentist’s Office
I am borrowing from Leonardo da Vinci’s wisdom when I preface this analysis with his quote “simplicity is the ultimate sophistication.” The purpose of this financial model is to be an illustrative tool with which to evaluate leveraged buyouts, roll-ups, and the purchase of dental clinics all at once.
The first skill set that is required to be an investor is the strategic skill set of building a total addressable market, analyzing the competitive landscape to get a perspective for market share, and building down to free cash flow by understanding drivers of cost structure.
The resulting analysis is below:

Market Sizing
As every consultant knows, to begin this analysis we must get a perspective for revenue. I used Chesterfield, MO as an example for the analysis 1) because suburban relatively high-income neighborhoods with low rent make for attractive dental roll up candidates and 2) because that’s my hometown.
To get to revenue, the Total Addressable Market (TAM) was calculated using the population, the population growth rate, and the percentage of individuals who go to the dentist annually. In reality, people are instructed to go to the dentist twice a year, but for conservative estimates, the population was projected to only go once. Additionally, there were no Chesterfield specific statistics but using household income and percent of individuals who go to the dentist by household income, the resulting TAM was 32,781 annual patient visits.
Competitive Landscape
After market sizing, an analysis had to be conducted on the competitive landscape. For simplicity, it was assumed that each of the 15 clinics in Chesterfield captured an equal share of the patients, and two dentists per clinic was calculated based on required capacity to meet patient need while attending to 5 patients per day. Turning that patient count into revenue required an annual patient revenue number, which the American Dental Association cites at $653 per year. This results in gross billings of ~$1.47 million for each dentist’s office, of which 84% is collected (insurance companies discount billings to doctors) for first year revenue of ~$1.24 million.
Cost Structure

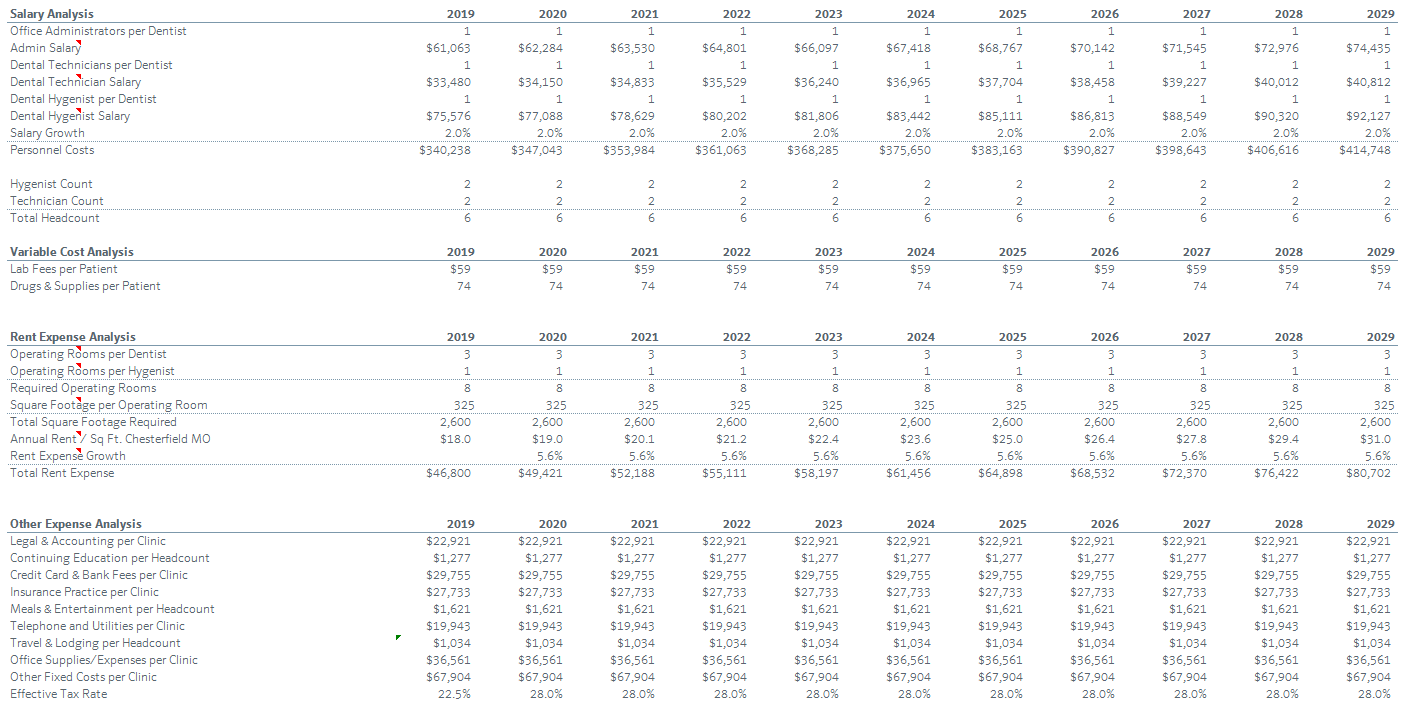
Dental cost structure was fairly straightforward, with support staff projected as a function of dentists in a clinic and using average salary for a dental admin, a dental technician, and a dental hygienist. Growth in their salary was also projected at 2%. Fixed and variable costs were projected using data from Cain Watters’ annual dental performance benchmarking survey, save for marketing costs and rent expense.
Rent expense was projected based on required operating rooms per dentist and hygienist as well as projected square footage for the entire office per operating room. Additionally rent/square foot and rental growth were analyzed for Chesterfield and built into the projection.

Marketing costs were calculated using a customer lifetime value vs. customer acquisition cost build. First, the churn rate was backed out from the average lifecycle of 8.5 years (primarily due to patients leaving the city), then the target new customers was projected as 25% above the churned customers for continued growth at an acquisition cost of $250/customer. This is a highly simplified example of one of the most important toolkits in a marketing executives set, which is analyzing CLV and CAC. Sophisticated marketers can segment the overall population and user base into various tranches and cater marketing strategies to the most valuable customers; however, the analysis presented here was highly simplified. Adept investors can switch into their marketing hats as easily as they can into their consultant hats.
Invested Capital

Finally, working capital primarily consisted of accounts payable and accounts receivable, which were benchmarked using industry average days payable and receivable, and capital expenditures were broken into maintenance and growth. Maintenance capital expenditures were equal to depreciation to maintain equipment and capital base, per 2.2% industry average. Growth capital expenditures were an initial ~$360,000 for updated equipment and integration costs.
Standalone Income Statement

The resulting income statement combining the above assumptions shows that operating one dental clinic has 5.1% top-line growth, 76% gross margin, 19% EBITDA margin, and 9% net margin all expanding due to some degree of operating leverage and pricing power. This aggregation of data into a consolidated financial statement is a critical accounting skill set that investors must master to present cohesive analysis.
Private Equity Value Creation
After evaluating the market, the competition, and the financials of a target company, private equity investors must understand what the investment approach is that will be used to drive returns in the investment.
Each private equity fund has a different approach to creating value in the businesses they invest in. Some of the most common are:
- Optimizing cost- looking for inefficiencies and optimizing the operations of the business to increase EBITDA
- Targeting growth- investing in new products, channels, customers, or simply taking advantage of organic tailwinds in the company’s industry
- Utilizing leverage- using residual cash flow to pay down debt and increase value through owning more of the business
- Investing in Distress- Investing at low multiples in distressed or struggling companies and then stabilizing them to sell at higher multiples
- Implementing Acquisitions- Implementing M&A, achieving scale benefits, reducing competition, or bolting on synergistic assets
Typically, private equity firms will utilize a combination of the above investment approaches and, after analyzing which approaches are utilized, a more granular look is taken to identify the key actionable areas to generate value. This skill set of identifying areas of improvement in a business and implementing those changes can be categorized as an operator skill set.
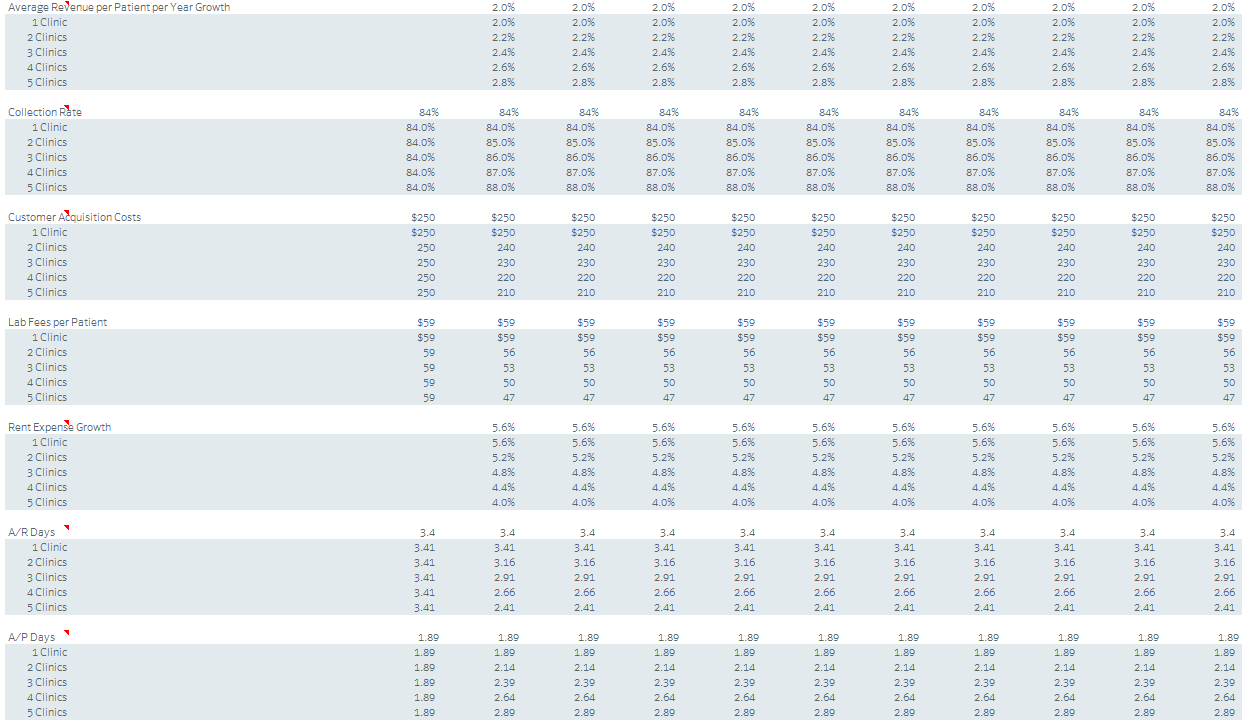
In the case of the dental clinic roll up, there are 6 primary value levers that can be pulled:
- Pricing power- patients are willing to pay more due to stronger brand, better offering, and lower competition
- Increased collection rates- larger dental clinics have negotiating leverage with insurance providers and better software for collections
- Lower customer acquisition costs- lower CAC results from software (customer relationship management software), brand investment, and larger footprint within a relevant geography
- Lower lab fees- since dental clinic is more strategically valuable to the labs, the clinic can receive bulk purchasing discounts for larger patient base
- Lower rent growth- the increased size renders operations more strategically valuable to land owners and provides negotiating leverage in expanding and moving into lower cost clinic locations
- More attractive cash conversion cycle- larger firms have more negotiating leverage over suppliers and can extend payables while collecting from insurance companies faster
These advantages are projected to increase as more clinics are rolled up per the below:

The Leveraged Buyout & Roll Up

The structuring of the transaction, including building the financial model, raising and servicing debt financing, and projecting returns comes from the valuation and transaction skill set.
When building the transaction model for the 5 clinics, a number of terms were utilized:
- 110% purchase price as % of revenue (referred to as collections)- a premium to the 70% — 85% collections range average
- Entrance into a revolver with L + 3.5% rate left undrawn (in advance of initial capital expenditure)
- 3x leverage with a term loan at L + 5.0% given strong margins and growth story in the business
- 4% transaction fees (higher than average because of multiple transactions for roll up and financing fees combined for simplicity)
- 10% management option pool from sponsor equity for incentive alignment
It should be noted that the capital expenditures scaled with the clinics rolled up because of the initial requirement to consolidate operations, integrate the businesses, and invest in new equipment across all clinics. The additional growth capital expenditure in 2020 was utilized to invest in the software required to increase collections, increase cash conversion cycle, and lower customer acquisition costs (for example, Customer Relationship Management software).
Below are the three statements and the debt sweep from this transaction


Returns

Assuming a very conservative 4.0x exit multiple vs. 4.87x purchase multiple and compared to an industry average of 5.0–6.0x multiple for multiple doctor, multiple location practices, 5 year returns yield a 4.4x multiple of invested capital (MOIC) and a 34.6% IRR. From a private equity investor perspective, this is a very attractive investment and warrants the amount of capital that has flooded the industry.
Takeaways
In an effective dental clinic roll up, the private equity sponsor purchases multiple individual practices, often at less than 1.0x revenue (characterized in the industry as a percentage of collections) and invests a considerable amount of capital into combining the organization, enhancing the software product suite, and improving the equipment used across clinics. The benefit of the increased size of the entity as well as the capital injection comes by way of pricing power, more effective collections, lower customer acquisition costs, lower COGS, lower rent expense, and more float resulting from a more attractive cash conversion cycle.
Crucially, these attractive returns stem from scale benefits, and as more clinics are combined under one organization within a given geography, the benefits of scale in terms of branding and negotiating power over suppliers accrue to the private equity sponsor. When evaluating the leveraged buyout of just one dental facility, the 18.2% IRR doesn’t present a particularly compelling investment given the risk profile and illiquidity associated with transactions like these. As more clinics are added to the fold, however, the resulting IRR values climb to the point that by 5 clinics, they are attractive across the majority of the sensitivity spectrum, particularly on lower purchase prices.
Taking a step back, private equity investing involves a number of complex skillsets.
First, in order to be a strong investor, a sponsor must be able to accurately project what revenue will look like, having a strong understanding of the industry, the risk profile (not covered but critical for diligence), and the idiosyncratic characteristics of the industry. This skill set is well aligned to the skills developed in a consulting role.
Second, given the emphasis on growth through new customers in this transaction, the investor needed to understand customer lifetime value and acquisition costs, as well as the more effective tactics to attract and retain new customers, which in more detailed scenarios includes cohort analysis, segmentation, and statistics. This is a skill set developed in the role of a marketing executive.
Third, investors must have a firm understanding of accounting and how to aggregate data into financial statements to understand performance and liquidity as well as to be able to present this information to stapled finance providers and investors. This is a skill set associated with Certified Public Accountants.
Fourth, investors must be able to identify areas for value creation- initiatives that can improve the quality of the business- and implement the changes necessary to capture that value. In our case, investing in new equipment and software were some of the major value drivers. This is an operator skill set, developed by high level executives.
Finally, an investor requires a technical and valuation skill set to put these pieces together and see the resulting return profile in a leveraged buyout transaction. This transaction skill set is similar to that of investment banking.
In short, this exercise was designed to illustrate at a very high level how a private equity investor evaluates a transaction and what skills are required to do so effectively.


